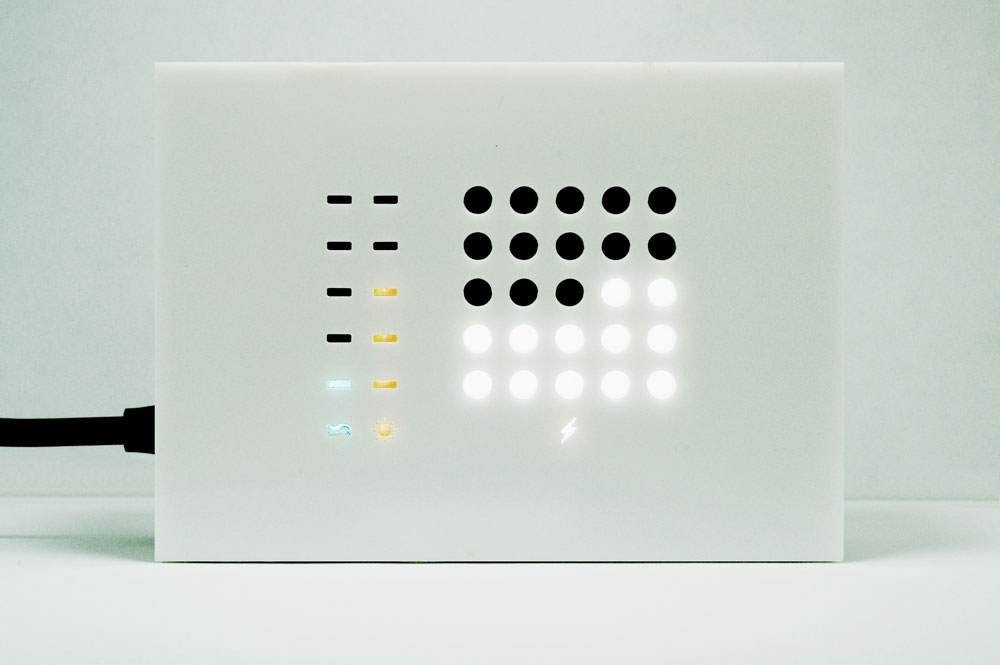
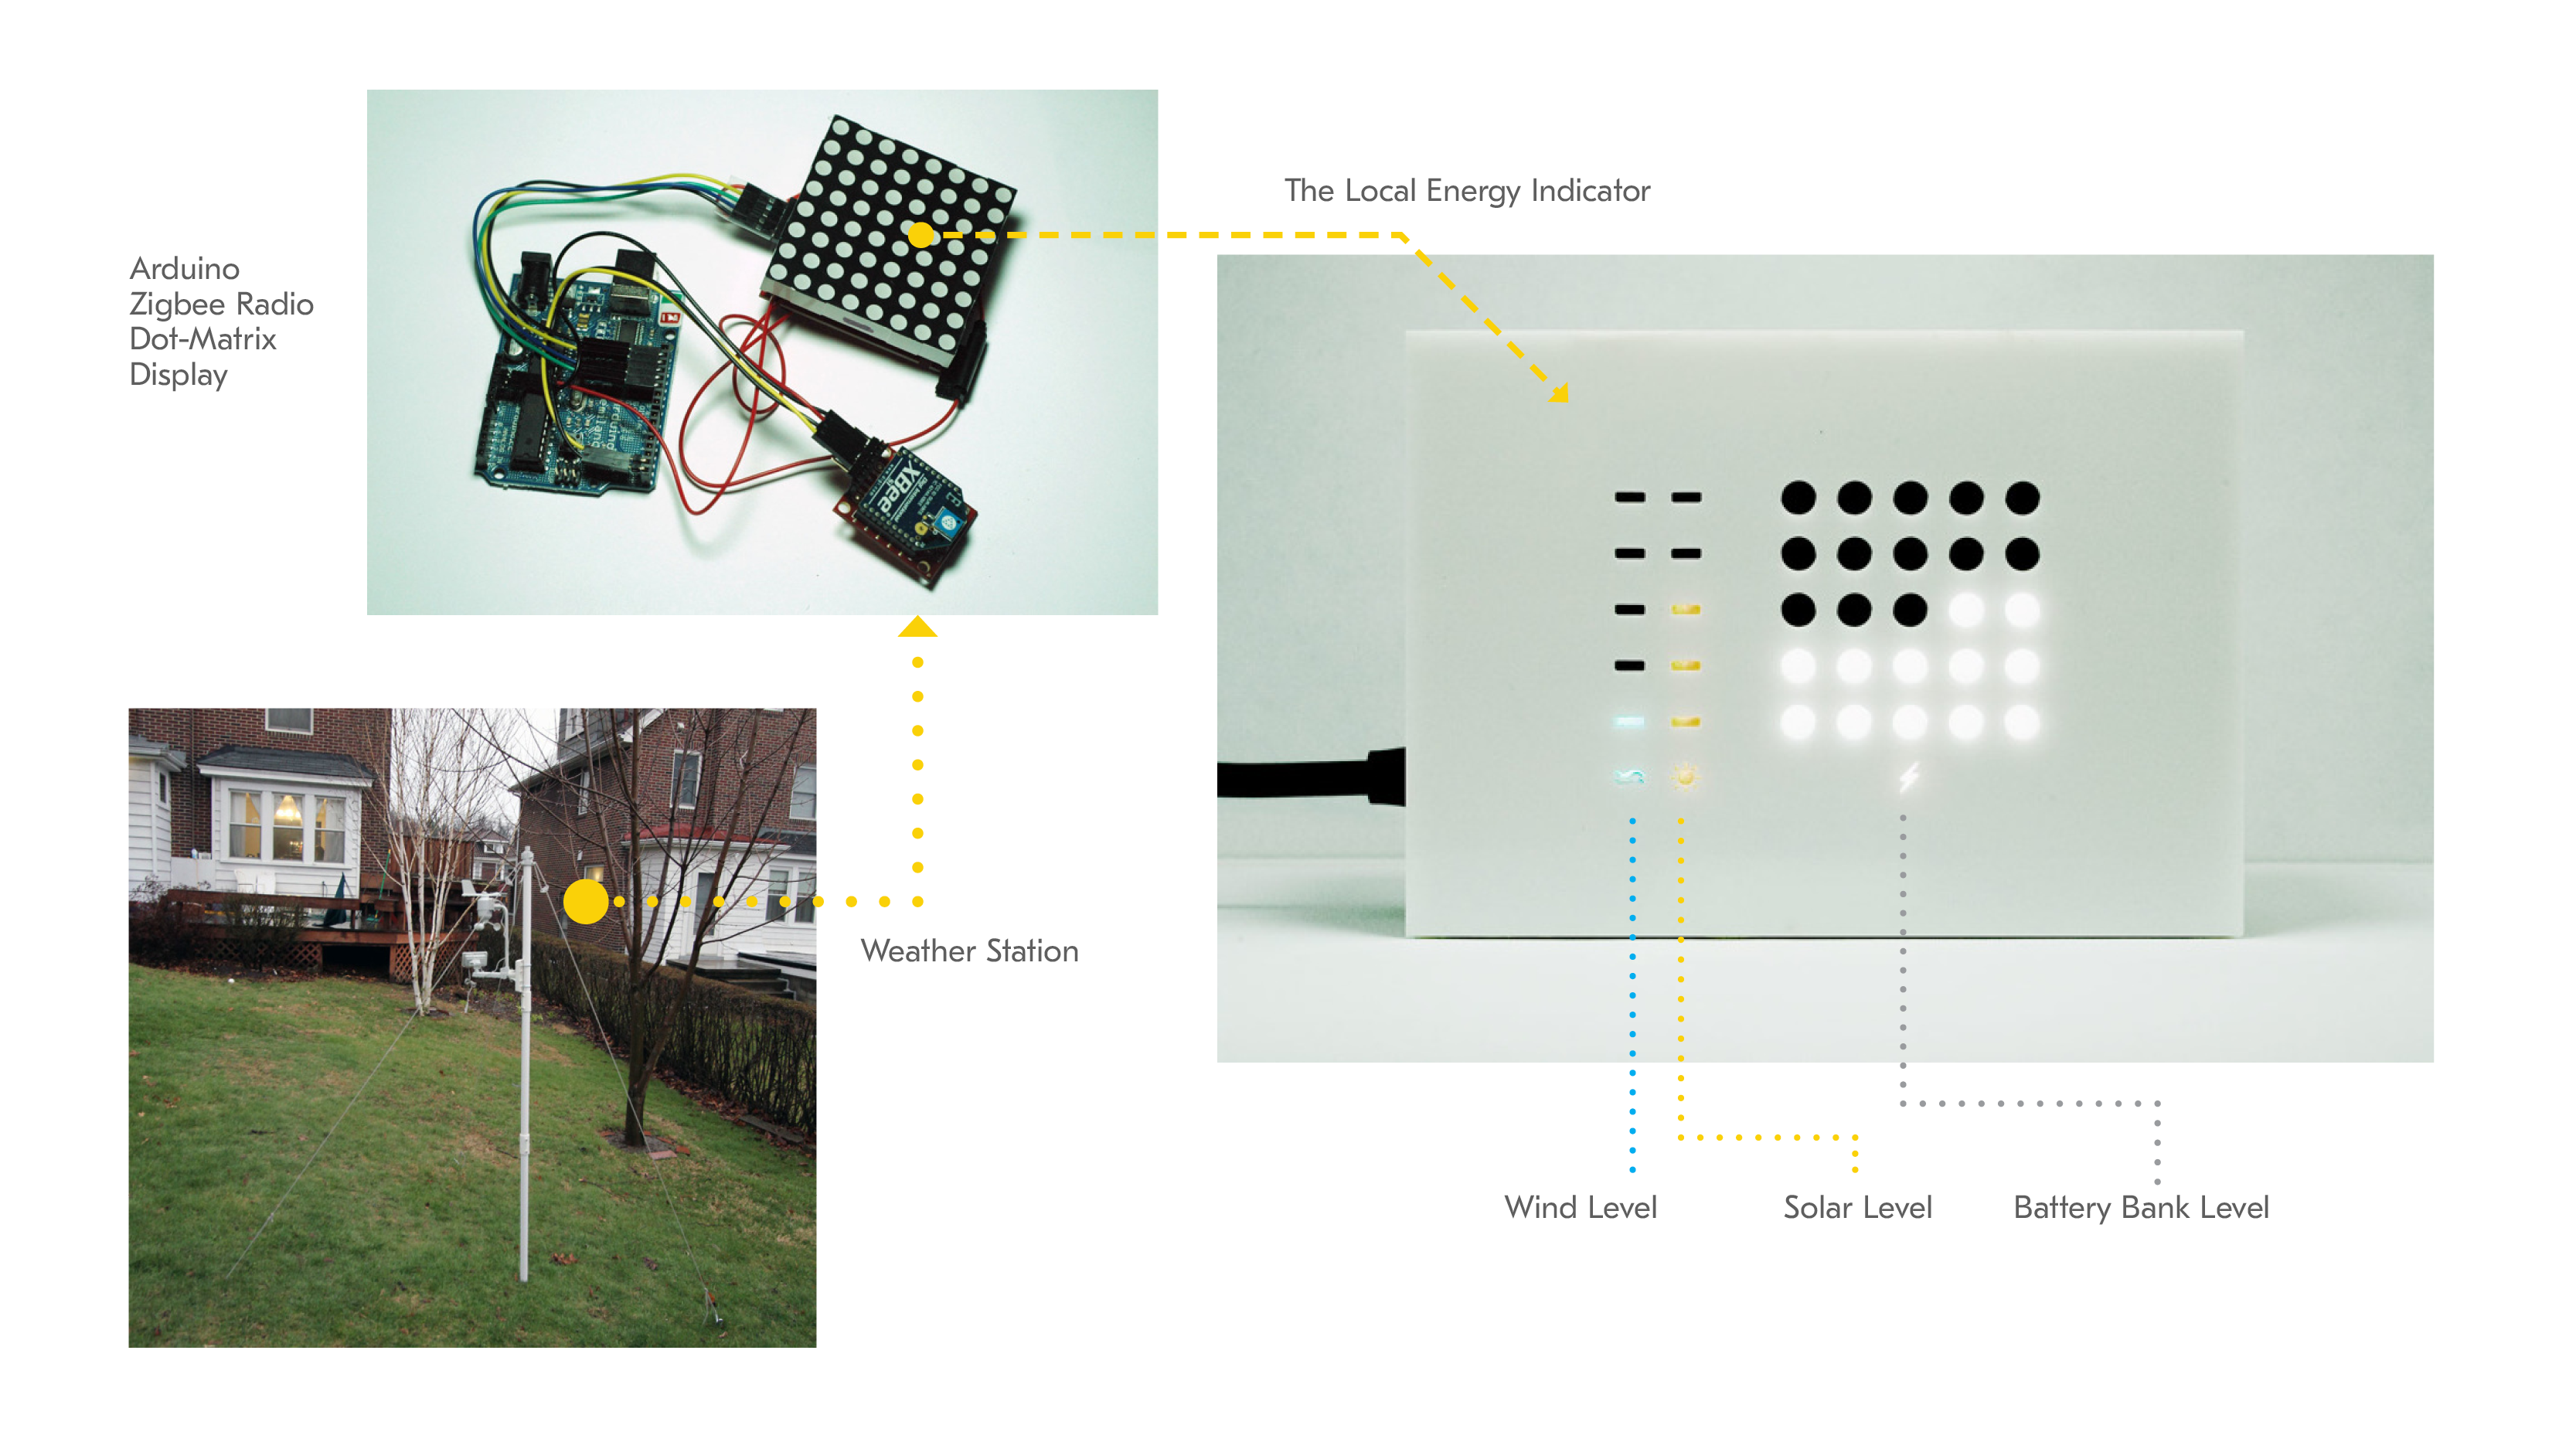
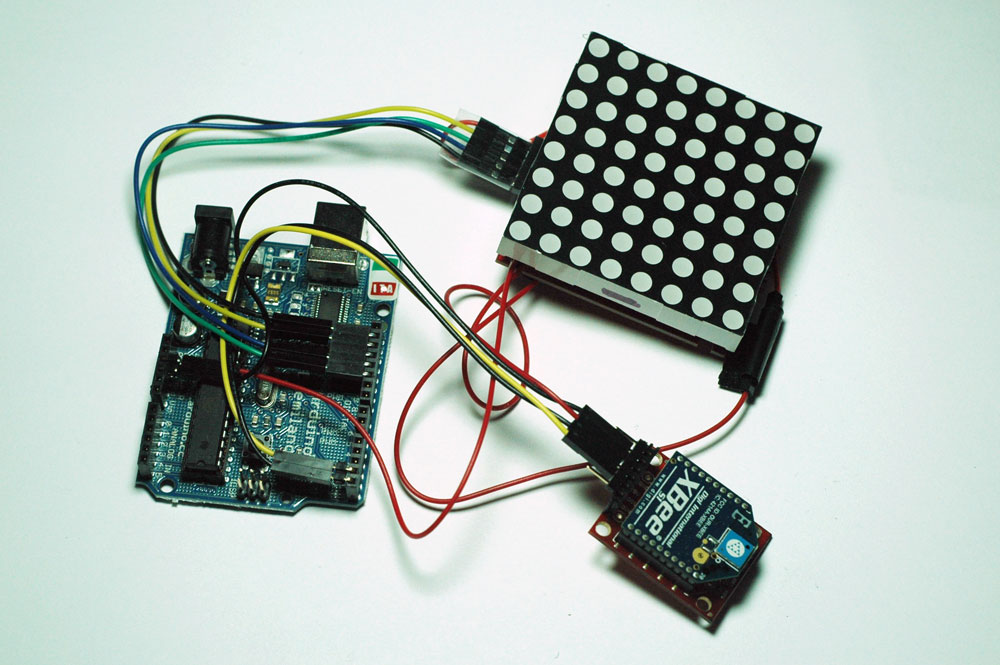
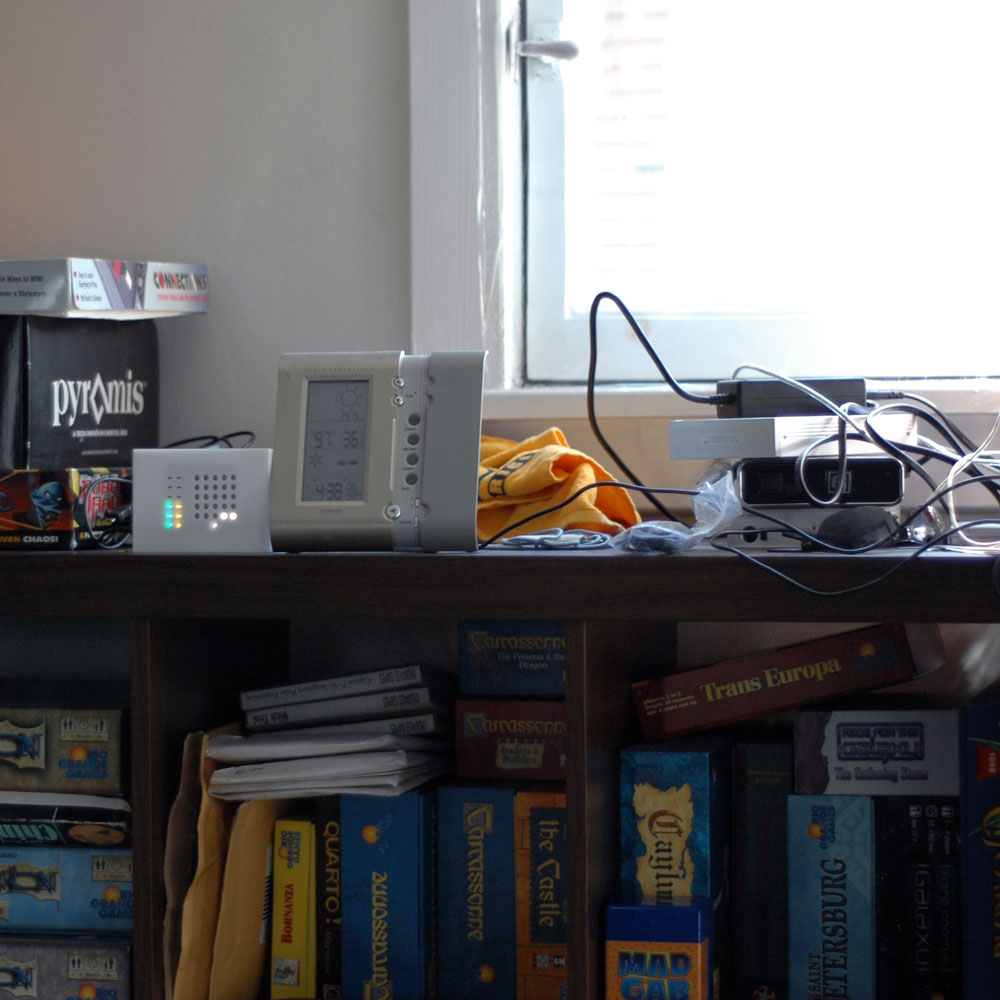
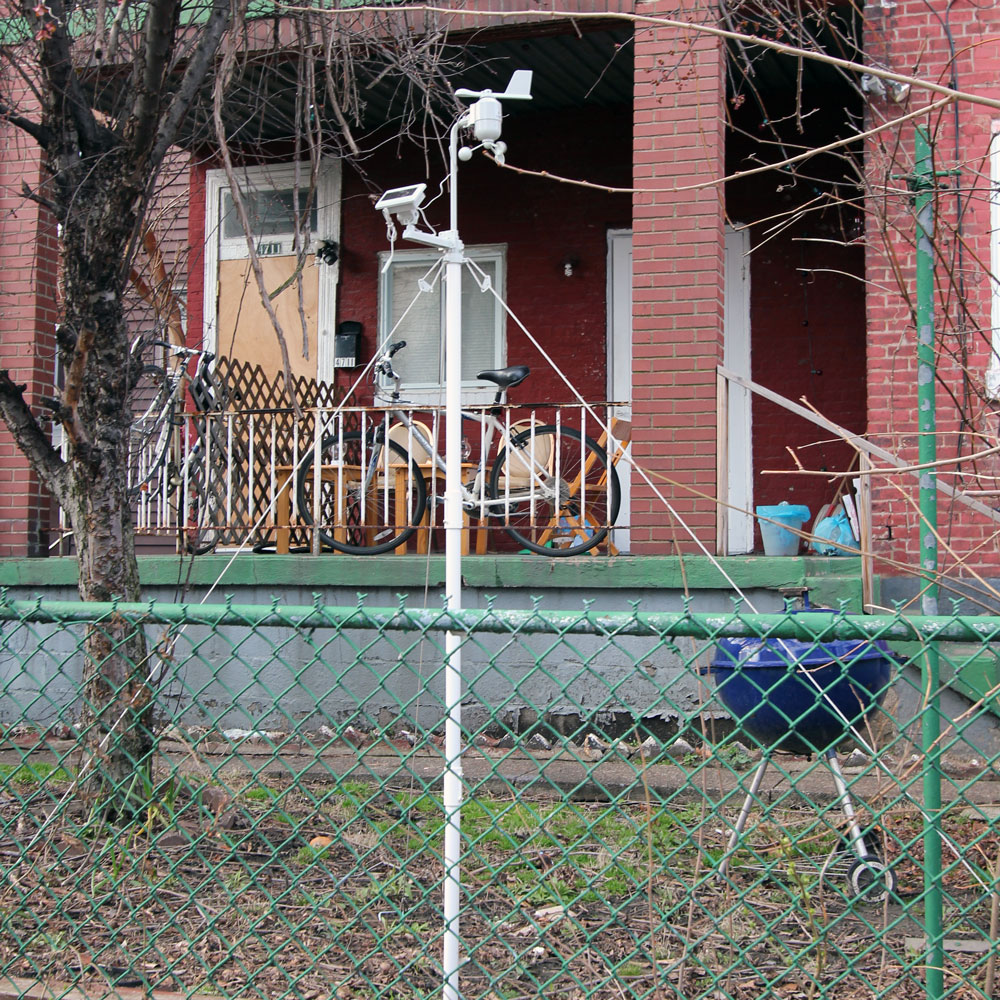
Because of the challenges with integrating our system with a functional microgeneration system, I chose to simulate domestic wind and solar generation using a home weather station. This led to prototype system that includes three primary components: (1) a set of local energy in-home display units for communicating local energy data, (2) a weather station for measuring the actual real-time potential energy collection, and (3) a computer for logging and relaying data from the weather station to the local energy displays. This system allowed us to prototype consumer-facing technologies before the infrastructure to support them is fully in place.
Study
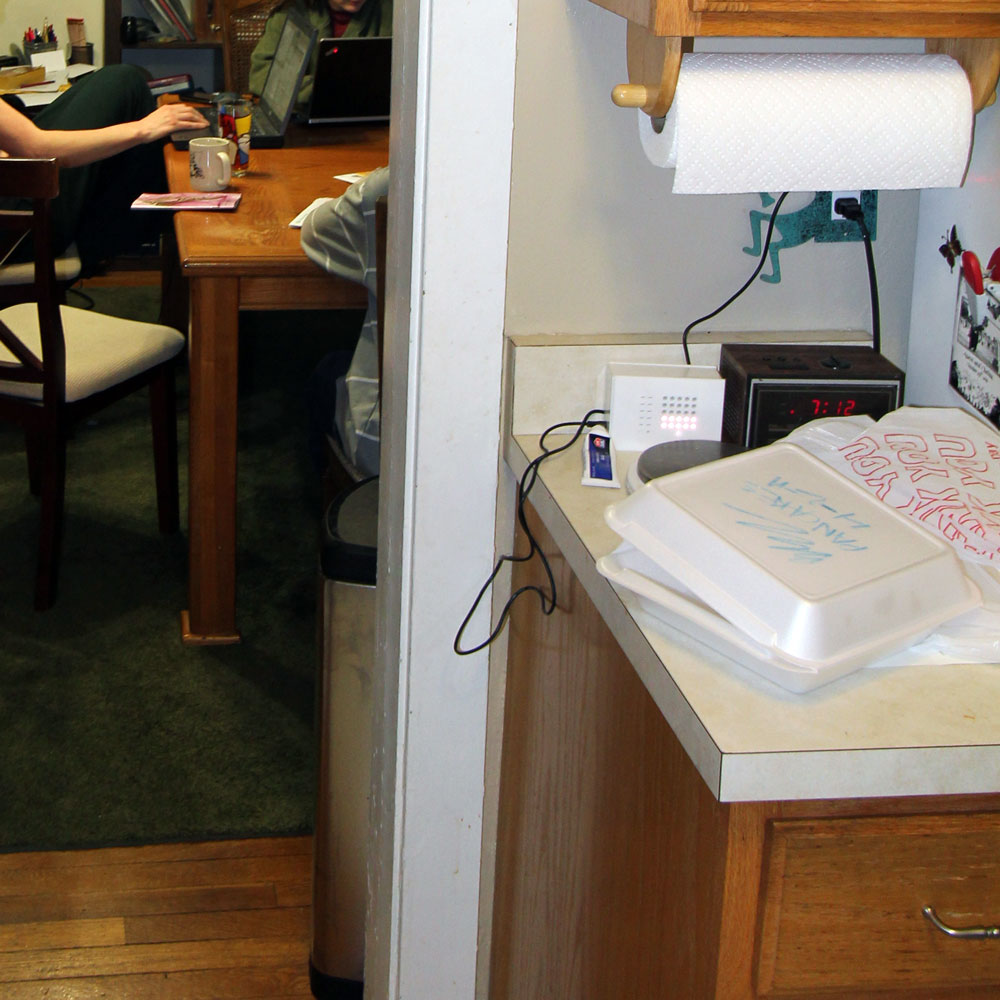
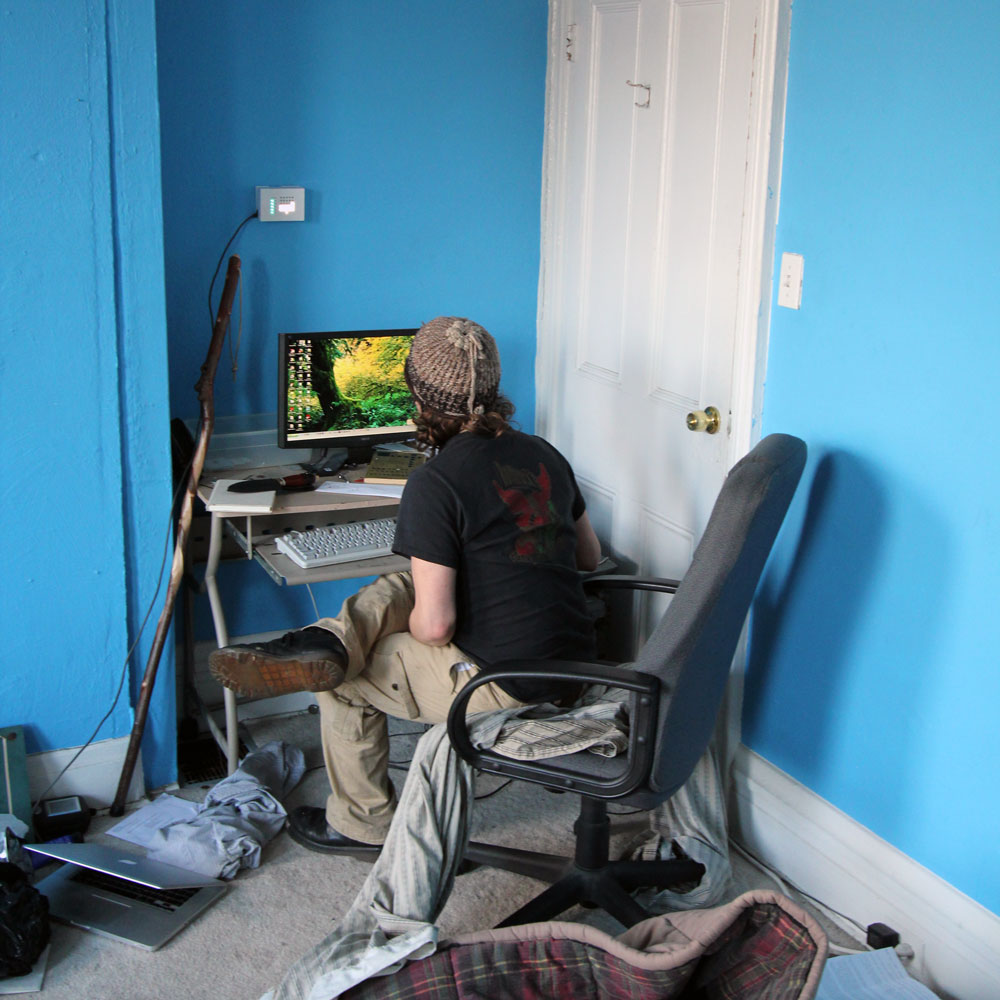
We deployed our systems in 2 homes for approximately 2 weeks each in March of 2011 in Pittsburgh, PA, USA. We recruited one household with members that self-identified with environmental issues and another group that did not. The study revealed that participants imagined ways they might shift their usage to times of day when the wind was blowing or sun was shining.

Related Publications
Pierce, J. and Paulos, E. (2012). The Local Energy Indicator: Designing for Wind and Solar Energy Systems in the Home. In Proceedings of DIS Conference on Designing Interactive Systems. New Castle, UK. DIS ’12. ACM Press, New York, NY.
Pierce, J. & Paulos, E. (2010, acceptance rate 15%). Materializing energy. In Proceedings of DIS Conference on Designing Interactive Systems. Arhus, Denmark. DIS ’10. ACM Press, New York, NY.